ChartDB
Instant DB Schema Visualizer
Free
Support platforms
web
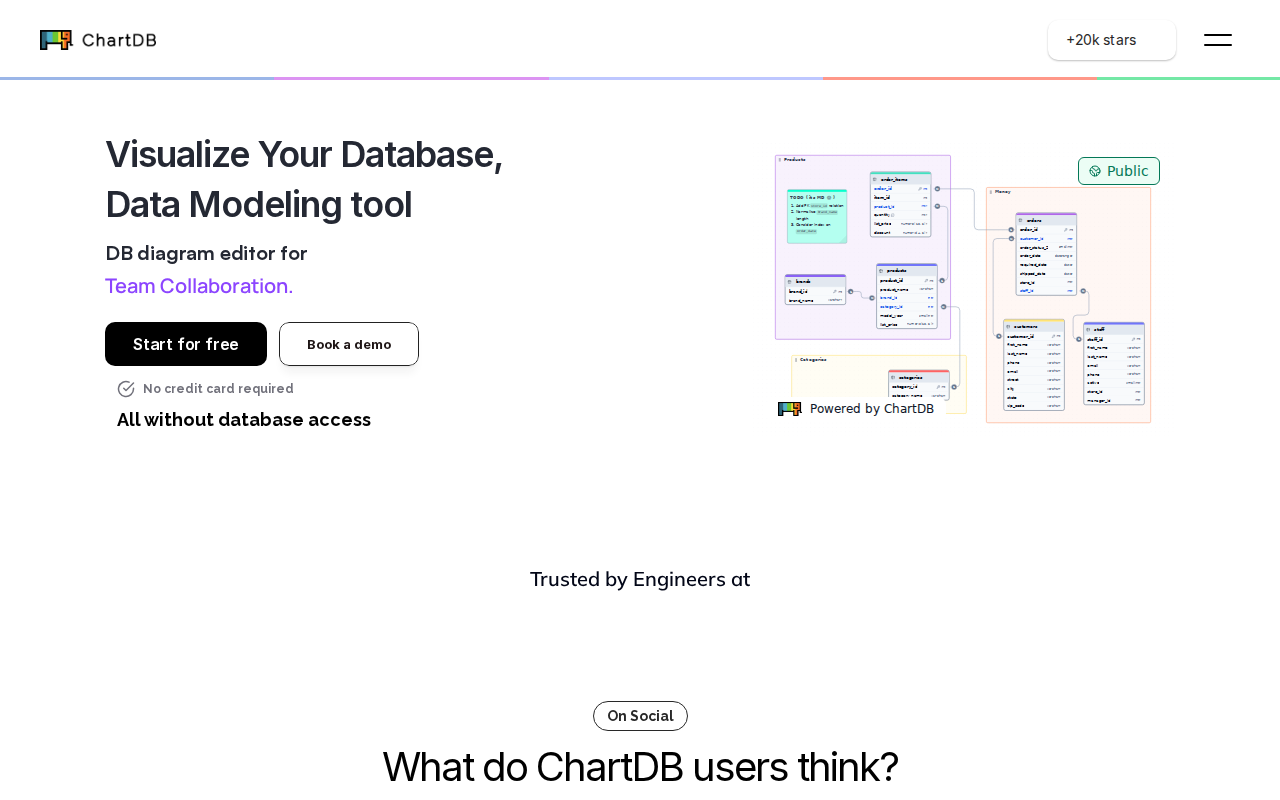
What is ChartDB
ChartDB is a specialized database schema visualization tool that enables developers to generate interactive ER diagrams instantly. By connecting directly to your database via connection strings or importing SQL dump files, it eliminates the manual effort of drafting schemas in tools like Lucidchart or Draw.io. Unlike static diagramming tools, ChartDB provides a live, navigable interface that allows users to explore complex relational structures, identify foreign key relationships, and understand data architecture without writing custom queries. It is built for database administrators, backend engineers, and data architects who need to visualize legacy systems or onboard team members to new database schemas rapidly.
ChartDB 's Core features
Direct Database Connectivity
ChartDB supports native connections to PostgreSQL, MySQL, MariaDB, and SQLite. By utilizing standard connection strings, it bypasses the need for manual schema entry. This real-time synchronization ensures that the visual representation is always accurate to the current state of the database, preventing the 'documentation drift' common with static diagramming tools.
Interactive ER Diagramming
The platform renders complex schemas as interactive, zoomable canvases. Users can toggle table visibility, trace foreign key relationships through color-coded lines, and filter by specific schemas. This interactivity is critical for large-scale databases with hundreds of tables, where static PDFs or images become unreadable and impossible to navigate.
SQL Schema Import
For security-conscious environments where direct database access is restricted, ChartDB allows users to upload raw SQL dump files. The parser extracts table definitions, primary keys, and foreign key constraints to build a local model. This ensures that sensitive production data remains untouched while still providing the benefits of high-fidelity visual documentation.
Auto-Layout Engine
The built-in auto-layout algorithm organizes tables based on relational density, reducing overlapping lines and visual clutter. This is particularly useful for complex normalized databases where manual positioning would take hours. The engine intelligently groups related tables, allowing developers to quickly grasp the logical architecture of a database upon first inspection.
Shareable Visual Documentation
Generated diagrams can be exported as high-resolution images or shared via unique URLs. This feature facilitates better communication between technical and non-technical stakeholders, such as product managers or business analysts, who need to understand data flows without having to query the database directly or interpret raw DDL scripts.
How to use ChartDB
Navigate to chartdb.io and select your database type (e.g., PostgreSQL, MySQL, SQLite).,Input your database connection string or upload a .sql schema file directly into the interface.,Click 'Visualize' to generate the interactive ER diagram based on your schema metadata.,Use the drag-and-drop canvas to rearrange tables and focus on specific relational clusters.,Export your finalized diagram as a PNG or share the live link with your team for collaborative review.
Use cases of ChartDB
Onboarding New Engineers
Engineering leads use ChartDB to generate instant visual maps of complex legacy databases. This allows new hires to explore table relationships and foreign key constraints visually, significantly reducing the time required to understand the data model compared to reading thousands of lines of DDL code.
Database Migration Planning
Architects use the tool to visualize the current state of a database before planning a migration or refactor. By seeing the relational dependencies, they can identify potential bottlenecks and ensure that schema changes do not break critical foreign key constraints during the transition.
Technical Documentation
Developers use ChartDB to generate up-to-date schema diagrams for internal wikis or project READMEs. Instead of manually updating diagrams after every schema change, they can quickly re-import the SQL file to produce a fresh, accurate visual representation of the current system state.
Who benefits from ChartDB
Backend Engineers
They need to manage and document complex relational databases. ChartDB saves them hours of manual diagramming and helps them communicate schema changes to the rest of the team effectively.
Database Administrators
They require a quick way to audit schema structures and identify orphaned tables or missing constraints across large-scale production databases without executing heavy analytical queries.
Data Architects
They focus on designing and maintaining data models. ChartDB provides them with a fast prototyping environment to visualize new schema designs and validate relational integrity before implementation.
Pricing of ChartDB
ChartDB is currently free to use. Users can connect databases or import SQL files without subscription fees or tiered limitations.