pandas
Python Data Analysis & Manipulation
Free
Support platforms
web
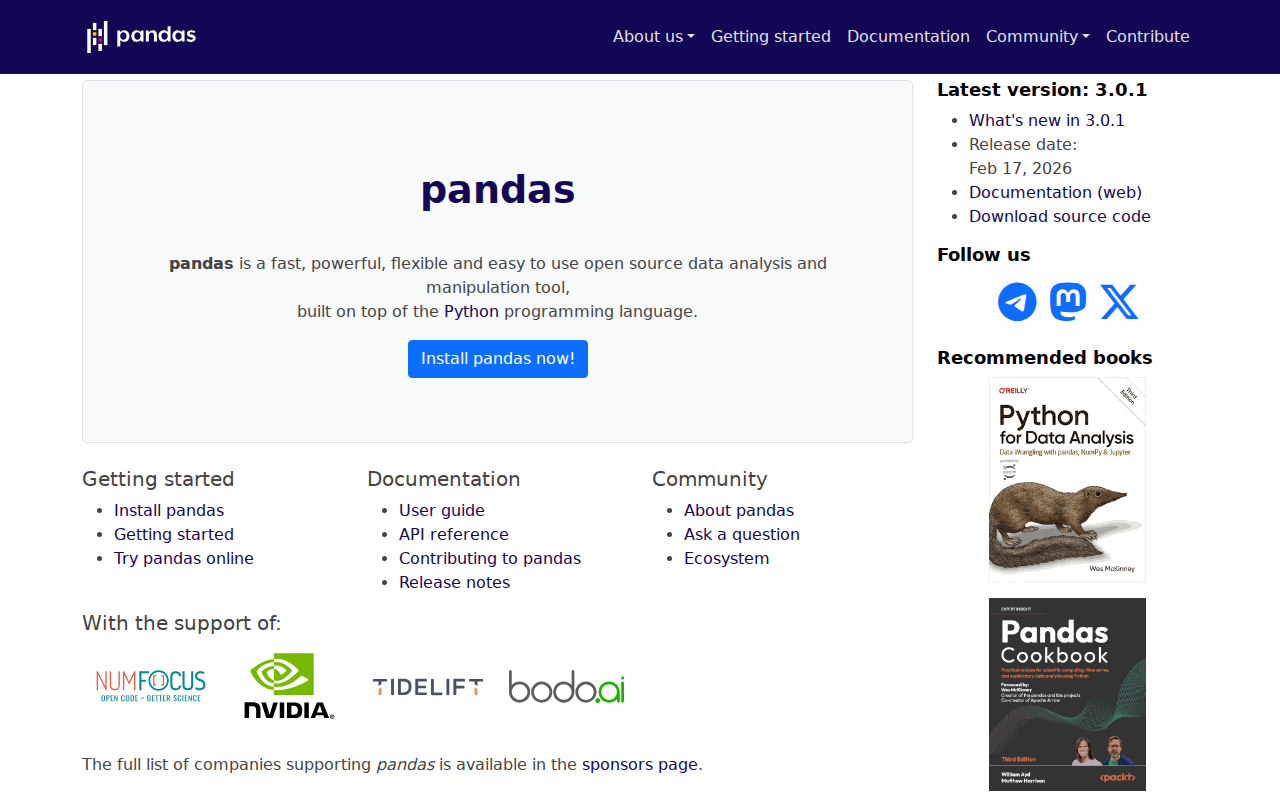
What is pandas
pandas is a powerful, flexible, and easy-to-use open-source data analysis and manipulation library built on top of the Python programming language. It provides high-performance, easy-to-use data structures like DataFrames and Series, enabling efficient data cleaning, transformation, and analysis. Unlike spreadsheet software, pandas allows for programmatic data handling, automation, and integration with other Python libraries for machine learning and visualization. It's unique in its ability to handle both structured and unstructured data, offering robust tools for data wrangling. Data scientists, analysts, and developers benefit from pandas' ability to streamline complex data tasks, accelerate workflows, and derive valuable insights from data.
pandas 's Core features
DataFrame Data Structure
The core of pandas, DataFrames provide a two-dimensional labeled data structure with columns of potentially different types. This structure is similar to a spreadsheet or SQL table. DataFrames allow for efficient data manipulation, including indexing, slicing, and merging, with optimized performance for large datasets. This structure is the foundation for most pandas operations.
Series Data Structure
Series represent a one-dimensional labeled array capable of holding any data type. They are the building blocks of DataFrames and provide a flexible way to work with single-column data. Series support various operations, including indexing, filtering, and arithmetic operations, making them essential for data selection and transformation. They are also used for time series analysis.
Data Cleaning and Preprocessing
pandas offers comprehensive tools for cleaning and preprocessing data, including handling missing values (using `.fillna()`, `.dropna()`), removing duplicates, and data type conversions. These functions ensure data quality and consistency, which is crucial for accurate analysis. These features are essential for preparing real-world data for analysis.
Data Input/Output
pandas supports reading and writing data from various formats, including CSV, Excel, SQL databases, JSON, and HTML. The `read_` and `to_` functions provide a consistent interface for importing and exporting data, simplifying data integration. For example, `pd.read_csv()` can read a CSV file directly into a DataFrame.
Data Analysis and Manipulation
pandas provides a wide range of functions for data analysis, including filtering, grouping, aggregation, and merging. The `groupby()` function allows for complex data aggregation, while the `merge()` function enables joining data from multiple sources. These capabilities enable users to perform advanced data analysis tasks efficiently.
Time Series Functionality
pandas offers robust time series functionality, including date range generation, time zone handling, and resampling. This makes it ideal for analyzing time-based data. The `resample()` function allows for changing the frequency of time series data, and the `dt` accessor provides convenient access to datetime properties.
How to use pandas
- Install pandas using pip:
pip install pandas.,2. Import the pandas library in your Python script:import pandas as pd.,3. Create a DataFrame from various data sources, such as a CSV file:df = pd.read_csv('your_data.csv').,4. Explore your data using methods like.head(),.info(), and.describe()to understand its structure and content.,5. Clean and transform your data using functions for handling missing values, filtering, and data type conversions.,6. Analyze your data using built-in functions for statistical analysis, grouping, and aggregation to derive insights.
Use cases of pandas
Data Cleaning and Transformation
Data analysts use pandas to clean and transform raw data from various sources. They handle missing values, correct data types, and remove inconsistencies to prepare data for analysis. For example, they might use `.fillna()` to replace missing values with a specific value or `.astype()` to convert a column to the correct data type.
Exploratory Data Analysis (EDA)
Data scientists use pandas to explore datasets, understand data distributions, and identify patterns. They use functions like `.head()`, `.describe()`, and `.value_counts()` to gain insights into the data's characteristics. This helps them formulate hypotheses and guide further analysis.
Data Integration and Merging
Analysts use pandas to combine data from multiple sources. They use the `merge()` function to join DataFrames based on common columns, creating a unified dataset for analysis. This is crucial when data is stored in different formats or locations.
Time Series Analysis
Financial analysts and economists use pandas for time series analysis. They can resample time series data, calculate rolling statistics, and perform time-based calculations. For example, they might use `resample('M')` to aggregate daily data into monthly data.
Who benefits from pandas
Data Scientists
Data scientists rely on pandas for data manipulation, cleaning, and analysis. It streamlines their workflow, allowing them to focus on model building and insights generation. pandas' flexibility and performance make it an essential tool for their daily tasks.
Data Analysts
Data analysts use pandas to explore, clean, and transform data from various sources. It enables them to prepare data for reporting, visualization, and business intelligence. pandas' ease of use and powerful features make it a core component of their toolkit.
Software Developers
Developers integrate pandas into their applications for data processing and analysis tasks. They leverage its data structures and functions to build data-driven applications, perform data validation, and create data pipelines. pandas' versatility makes it a valuable asset for a wide range of software projects.
Financial Analysts
Financial analysts use pandas to analyze financial data, perform time series analysis, and create financial models. The library's time series capabilities and data manipulation tools are essential for their work. They use it to analyze market trends and make informed decisions.
Pricing of pandas
Open Source (BSD-3-Clause License). Free to use, modify, and distribute. No paid plans or tiers.